
Monitoring the quality of experience (QoE) for corporate voice networks is essential in today’s hybrid workplaces, where productivity is essential for staying competitive. Effective communication, as any business school worth its salt will tell you, is critical to achieving your goals.
Yet now, with Microsoft Teams becoming the premier unified communications platform with 320 million monthly active users1, IT managers need to be able to monitor the QoE of peer-to-peer Teams calls as well as external calls over SIP trunks.
But what’s the best way for hard-pressed IT managers to perform this vital task effectively?
Meet the One Voice Operations Center
Say hello to the AudioCodes One Voice Operations Center (OVOC), an innovative solution that seamlessly combines full device management and network quality monitoring for UC deployments into one easy-to-use application.
OVOC has an exceptionally intuitive UI design that lets you control all UC network elements from one central location for their whole lifecycle, allowing you to perform device management, voice quality monitoring and advanced routing with ease and efficiency. It also makes things like root cause analysis, bulk software updates and the adding of new devices to the UC network much simpler and faster than before.
In addition, OVOC provides deep insights into network trends and performance, allowing you to optimize planning and design, and also helps you find and fix voice quality problems before your users notice them.
You’re the Boss!
If you already enjoy OVOC’s considerable management and monitoring capabilities, you can now take advantage of a brand-new, customizable QoE Analytics module that’s just been released. It’s an even easier and more convenient way to enhance network performance using OVOC, since it enables you to analyze every element of the relevant data very quickly and efficiently, in the way that makes most sense to you visually.
The module consists of three unique parts:
A QoE Dashboard
This dashboard has a default combined view with SIP trunk and Teams statistics widgets, enabling you to select from a predefined set of about 50 widgets. The type and size of each graph can be changed easily, and all users and customers (tenants) can save their own dashboard view. You can filter data according to devices, links and sites, and you also have a real-time view based on one week’s worth of data.
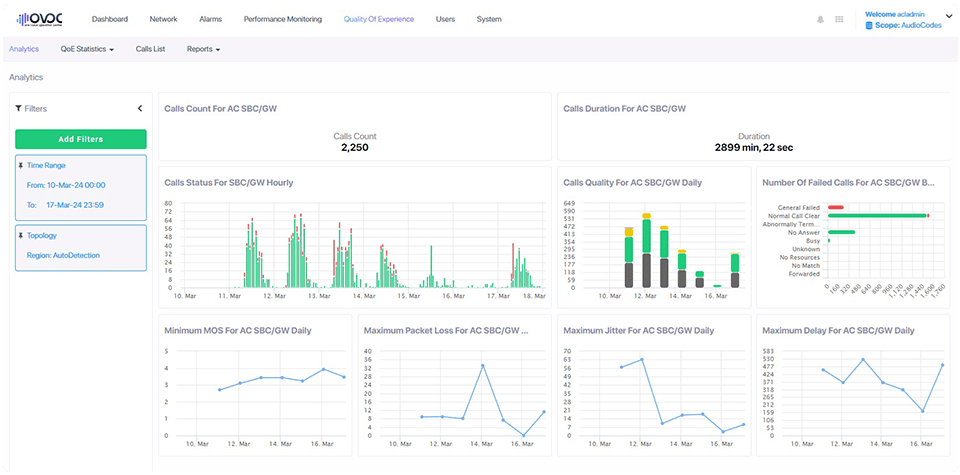
Figure 1: Main Dashboard
Figure 2: Configuration Option Screens
Self-Service Reports
This new functionality allows you to create fully personalized reports with multiple customization options. You can see the results right away in OVOC, or you can receive them as regular scheduled emails in CSV or PDF formats. You can also take advantage of long-term data storage, up to one year.
An Analytics API
This is an SQL-based API that enables you to create customized dashboards using third-party tools like Power BI, Splunk and others. These tools extract data from OVOC and merge it with data selected from other sources, so you can see all your key information for things like devices and links details, alarms, calls and QoE statistics in one place.
See OVOC’s Powerful Analytics in Action for Yourself
So if you care about network performance and voice quality, and in this day and age you most certainly should, then why not check out OVOC’s powerful new customization features in action with a no-obligation demo from one of our experts. Alternatively, you can get some hands-on OVOC experience at your own pace with a free demo license.
1 https://www.microsoft.com/en-us/investor/events/fy-2024/earnings-fy-2024-q1.aspx
